Real-Time IntraVUE Management
WBC Network Health Monitor collects data continuously from all the configured IntraVUE hosts, regardless of which one is currently being viewed in a browser. Currently to see the status of all IntraVUEs being monitored, the Connection dialog provides a color coded Status as well as a count of the number of Alarms and Warnings. A supervisor-like app will be developed to better provide status on many IntraVUEs at once.

When a IntraVUE is selected the user interface is about that one Intravue. The IntraVUE Status is the first dialog to appear after selecting an IntraVUE. The Status provides an immediate answer to 'is my network ok?'. If you see all green you can be assured there is not an issue related to network performance.
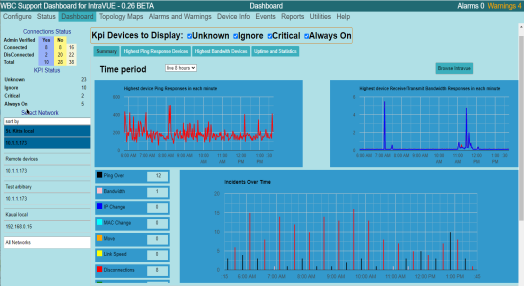
When you select Dashboard from the top menu WBC Network Health Monitor presents a number of selectable graphics. IntraVUE Dashboard shows the statistics used to determine the overall health of each configured network of the IntraVUE It has several graphical panels.

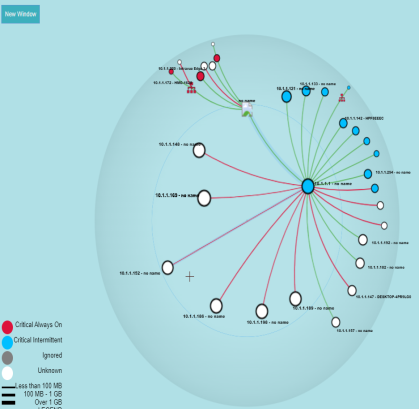
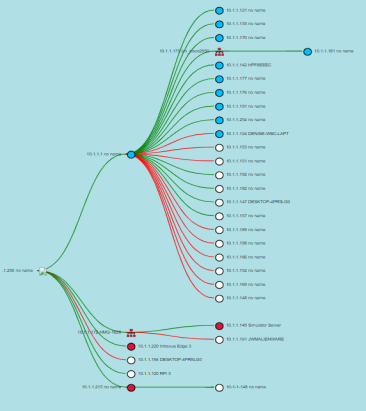
Under Toplogy Maps are two other real-time graphics.
Hypertree Network Map presents a hypertree view of the network, similar to the hyperbolic tree view available in IntraVUE 2.
Tree View Network Map presents a view similar to an organization chart of the devices in the network.
And for convenience, there is a link to the Intravue Topology Map


